Veriler
Azerbaycan İlleri
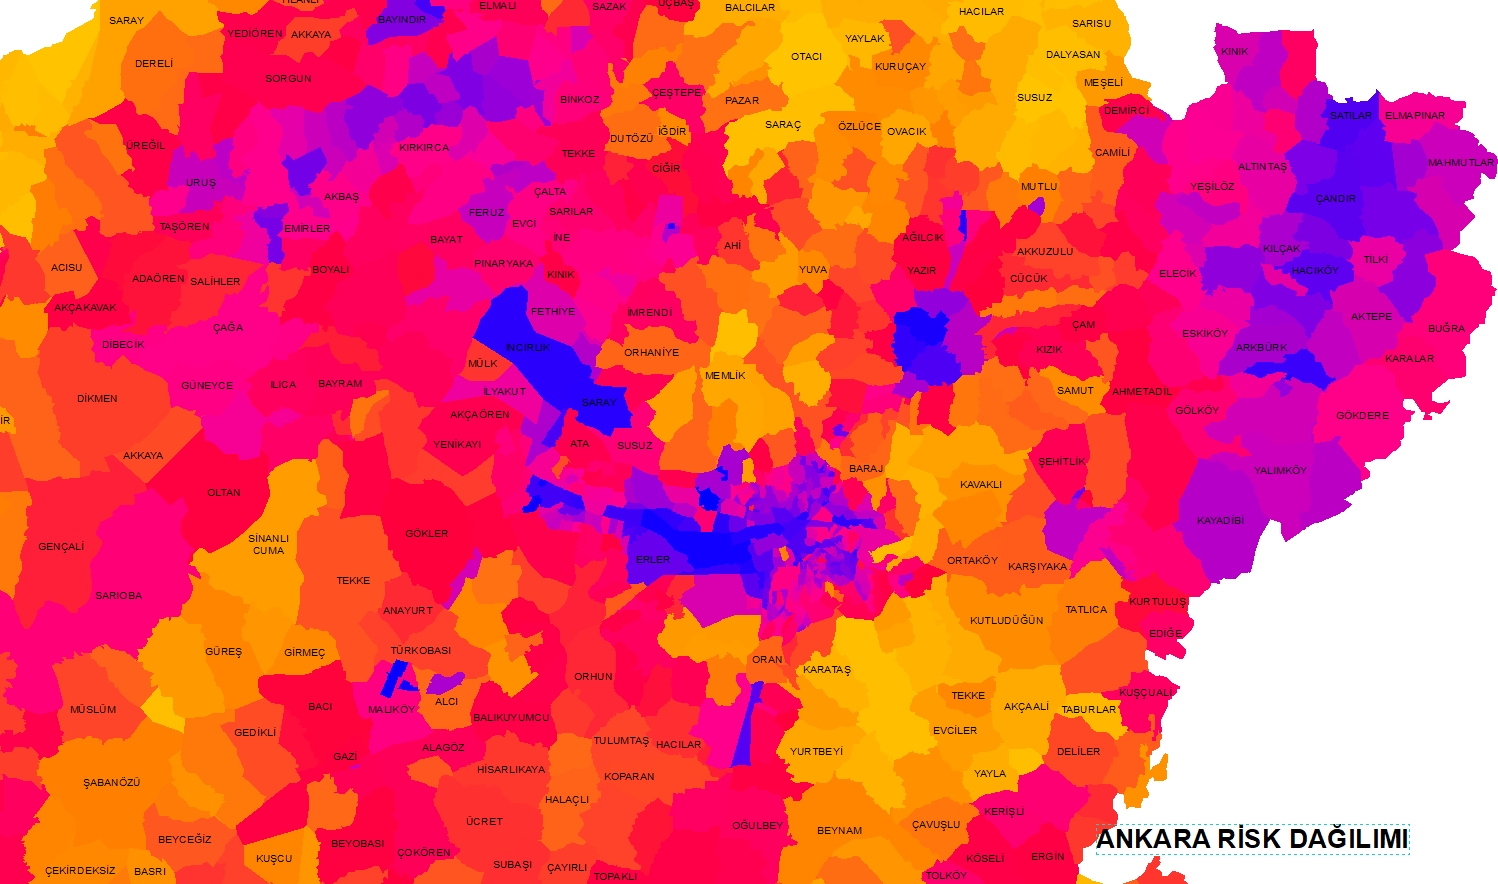
RISK DATA
It is a neighborhood level risk data consisting of 40 layers covering the whole of Turkey.
It includes all villages and neighborhoods in the National Address Database.
All information is given in 1 table and the Risk Index is also produced.
Independently from this data, you can also obtain the "earthquake hazard risk at the neighborhood level" data.
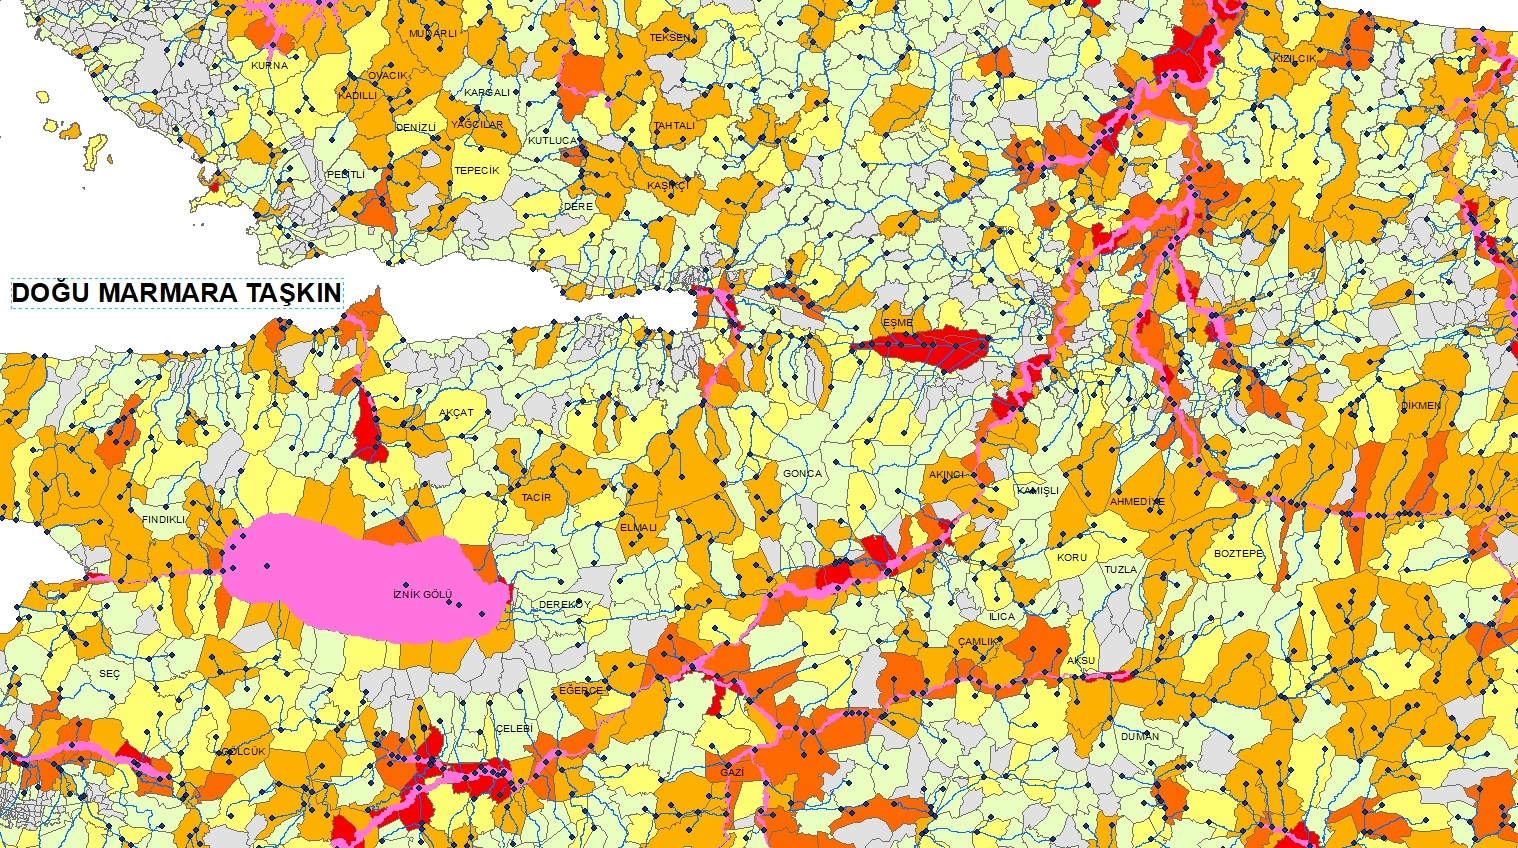
Doğu Marmara Taşkın Haritası

Doğu Marmara taşkın ve su baskını risk haritası.
Neighborhood-Level Risk Data | Earthquake, Flood, Altitude
It includes digital boundary and location data, street and avenue details optimized for neighborhood development analysis; Data is provided in GeoJSON, SHP, KML/KMZ formats, data management and update flow are supported with geodatabase.
Village boundary and rural location data are structured with geographic accuracy, street connections and development metrics; Files are delivered in KML, KMZ, GeoJSON and SHP formats and can be used in both web and desktop GIS applications.
This digital district map; It provides geographic data accuracy, location-based development indicators, street and avenue geometries and neighborhood and village boundaries digitally; It can receive vector output in GeoJSON and SHP format, and is optimized for mapping engineers and data experts, compatible with KML/KMZ files.
Accurate geodata and vector maps for experts
SHP/KML/KMZ/GeoJSON delivery at neighborhood map, village boundary and street-street level. Get a quote for your colorful, high-quality and professional digital map needs.
Professional KML/KMZ & GeoJSON data packages
District maps, neighborhood boundaries and detailed street data; digital map and geodatabase solutions prepared for experts. Click to have a map made or to purchase data.
Digital map and geodatabase services
Street, avenue, neighborhood and village boundary data; delivered in SHP, GeoJSON, KML/KMZ formats. Write to us for professional, accurate and expert-focused geographic data solutions.
TABLE STRUCTURE
| AREA NAME | AREA DESCRIPTION | |
|---|---|---|
| ILADI | Province Name | |
| ILKAYITNO | Province Code | |
| ILCEADI | District Name | |
| ILCEKAYITN | District Code | |
| KOYADI | Settlement Name | |
| KOYKAYITNO | Village Code | |
| MUNICIPALITYAD | Municipality Name | |
| NEIGHBORHOODAD | Neighborhood Name | |
| NEIGHBORHOODCODE | Neighborhood Code | |
| CODE_X | Common ID for Village and Neighborhood | |
| TASKIN_YUZDE | Information on how much of the neighborhood or village is within the natural flood or inundation area in terms of surface area | |
| LANDSLIDER_ISTANBUL | Information on how much of the neighborhood or village is within the landslide and avalanche area in terms of surface area | |
| SUTOPLAMA_YUZDE | Information on how much of the neighborhood or village is within the natural or artificial water collection area in terms of surface area information | |
| VOLKAN_YUZDE | Information on how much of the neighborhood or village is within the volcano risk area | |
| ZEMIN_MAX | Information on the highest ground risk within the neighborhood or village area | |
| ZEMIN_YUZDE | Information on how much of the neighborhood or village is within the ground-based risk area | |
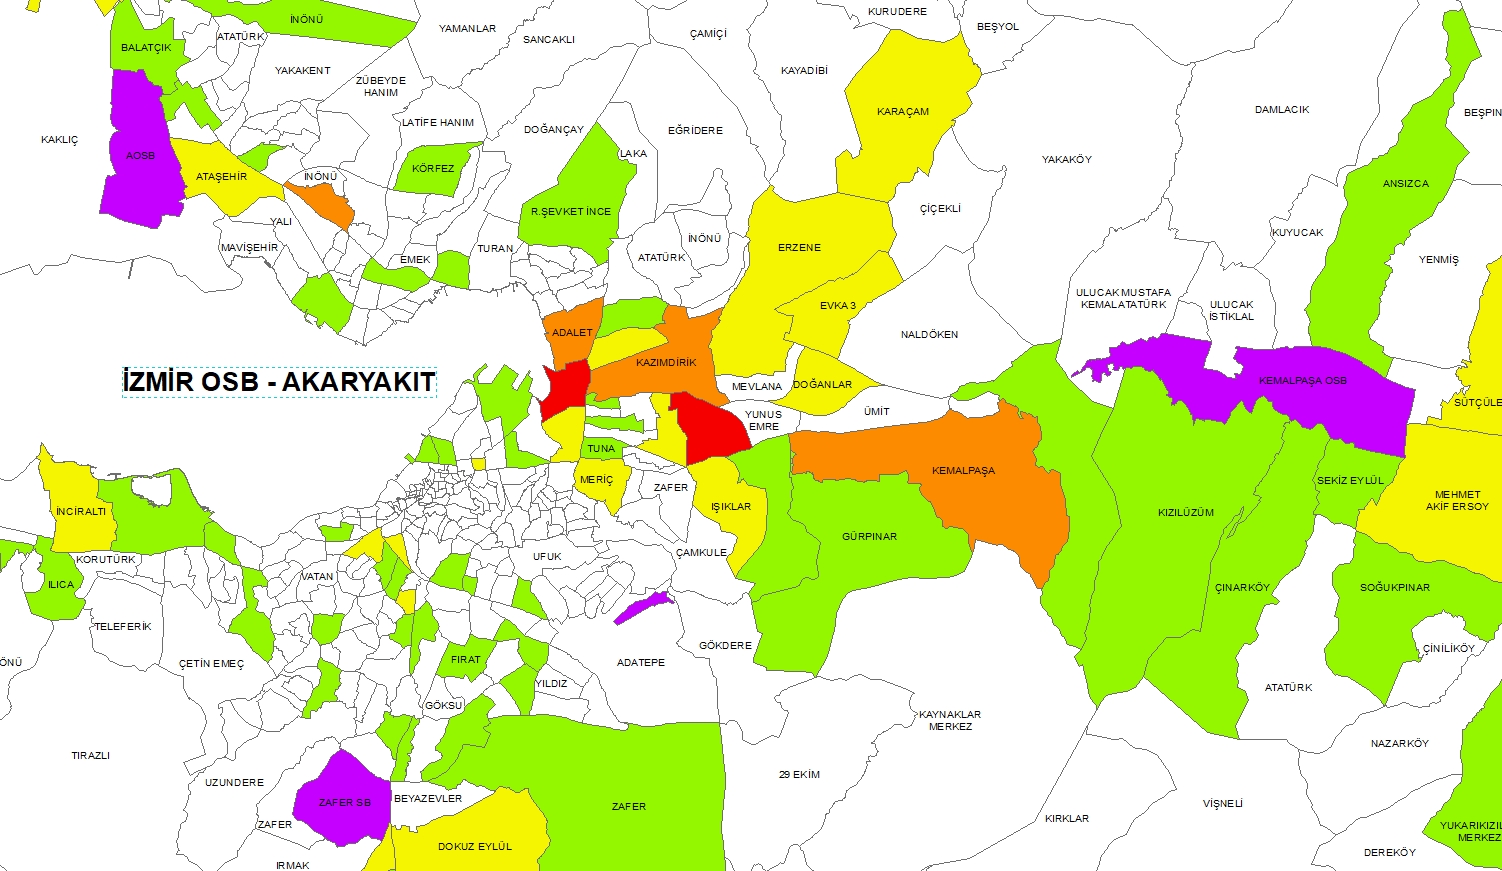
| FUEL OIL | Index of the fuel station in the settlement. 4 is the highest value, 0 is not | |
| AIRPORT_DISTANCE | Distance to the airport is given. After 4 km, it is given as 4000. | |
| COASTAL_SU_RAID | Is there a risk in case of sea rise? | |
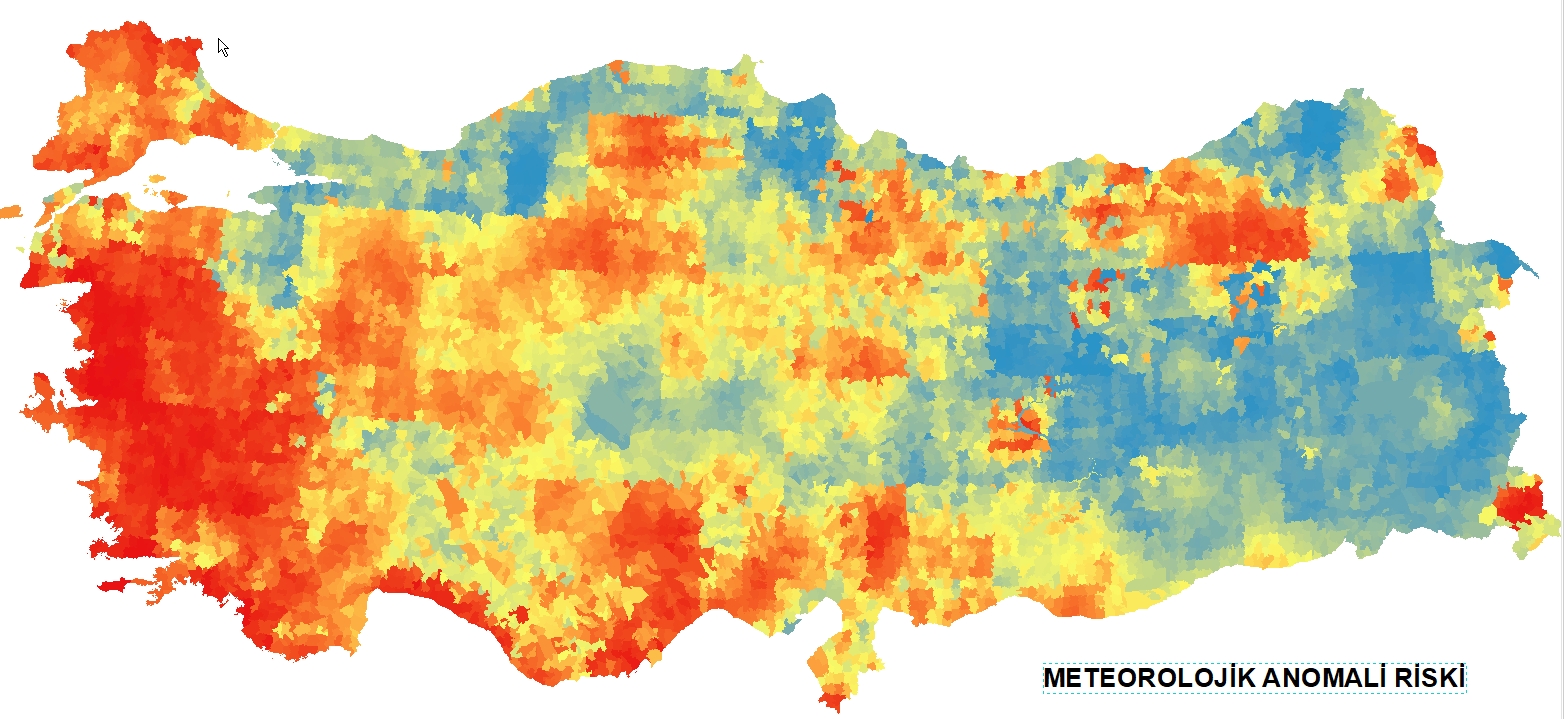
| METEOROLOGY_RISK | Regional risk index based on anomalies within the scope of climate change. Scientific study of ITU meteorology department. | |
| ORMAN_FIRE | Indexing the regional forest fire risk based on the highest temperature and vegetation cover for the day. | |
| TASKIN_RISK_NOTION | Information on stream confluence and discharge points. | |
| TSUNAMI | A risk that evaluates flooding that may occur with earthquake-based waves with regional elevation. | |
| FAY_DISTANCE | If the fault passes through a neighborhood, the distance to the fault line is given, 0 meters. | |
| FAY_TUR | The type of fault is also specified. | |
| RIVER_PERCENTAGE | It shows how much of the neighborhood or village the streams cover. | |
| MIN_GRIDCODE | Height minimum | |
| MAX_GRIDCODE | Height maximum | |
| AVE_GRIDCODE | Average height | |
| F30_LOW | Surface area ratio of the area with lower than 30 degrees ground risk in the neighborhood | |
| F30_50 | Surface area ratio of the area with 30-50 degrees ground risk in the neighborhood | |
| F50_70 | Surface area ratio of the area with 50-70 degrees ground risk in the neighborhood | |
| F70_UPPER | Surface area ratio of the area with higher than 70 degrees ground risk in the neighborhood | |
| RISKY | Surface area ratio of the area with high ground risk in the neighborhood | |
| WATER | How much of the neighborhood is water in terms of surface area | |
| PLOT | How much of the neighborhood is land in terms of surface area | |
| URBAN_GREEN_AREA | How much of the neighborhood is urban in terms of surface area green area | |
| HOUSING_YOG_10 | How much of the neighborhood is low density housing in terms of surface area | |
| HOUSING_YOG_100 | How much of the neighborhood is high density housing in terms of surface area | |
| HOUSING_YOG_30 | How much of the neighborhood is 10-30% density housing in terms of surface area | |
| HOUSING_YOG_50 | How much of the neighborhood is 30-50% density housing in terms of surface area | |
| HOUSING_YOG_80 | How much of the neighborhood is 50-80% density housing in terms of surface area | |
| MINING_CONSTRUCTION | How much of the neighborhood is mining or construction in terms of surface area. FOREST_AND_NATURAL_AREA | How much of the neighborhood is forest or natural area in terms of area |
| SPORTS | How much of the neighborhood is sports area in terms of area | |
| AGRICULTURE | How much of the neighborhood is agricultural area in terms of area | |
| TRANSPORTATION_ROAD_AIRPORT_PORT | How much of the neighborhood is transportation area in terms of area | |
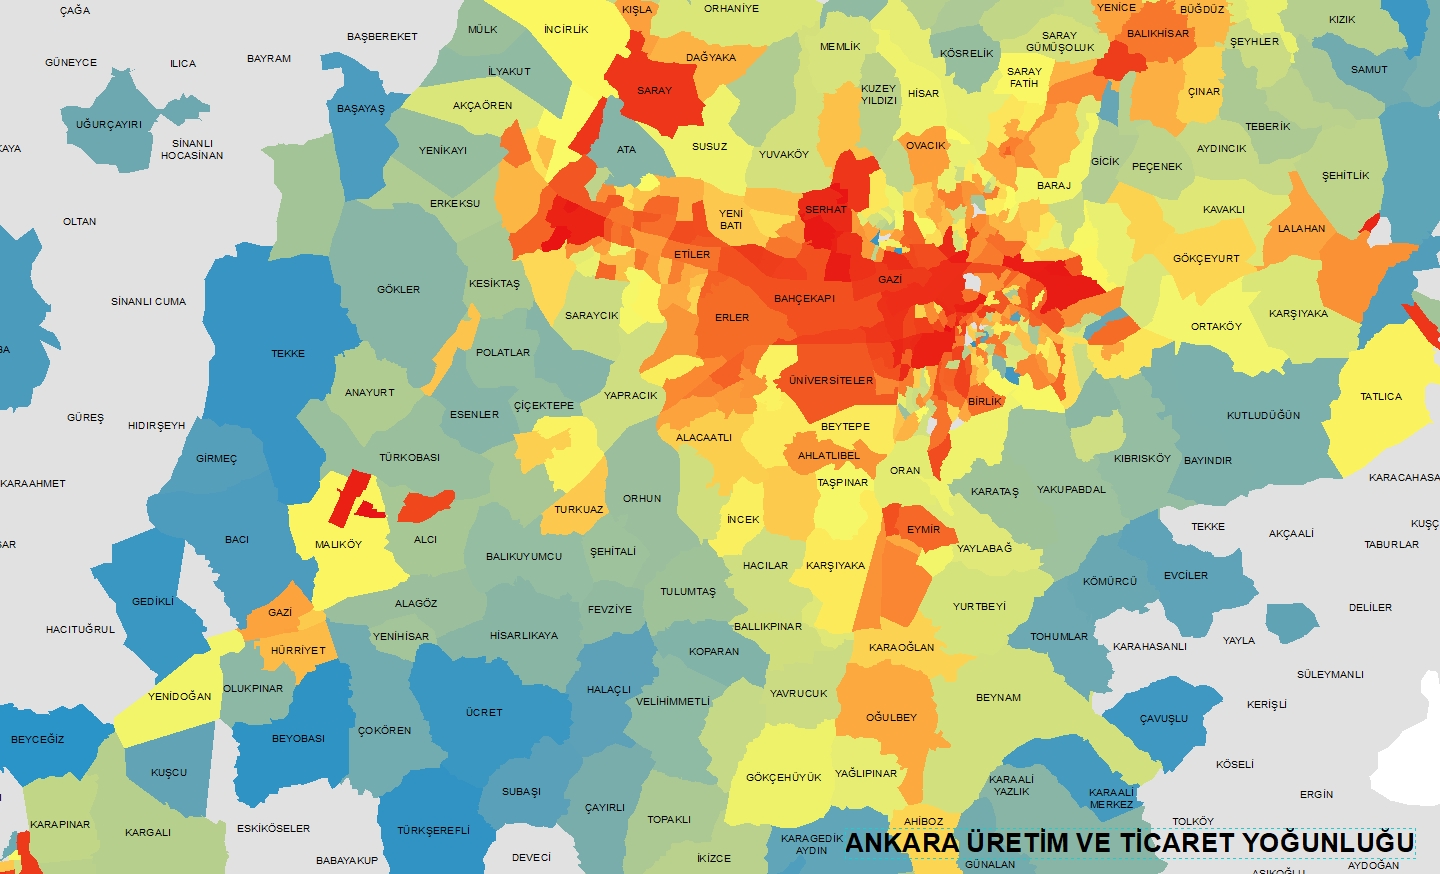
| PRODUCTION_AND_COMMERCE | How much of the neighborhood is production and trade area in terms of area | |
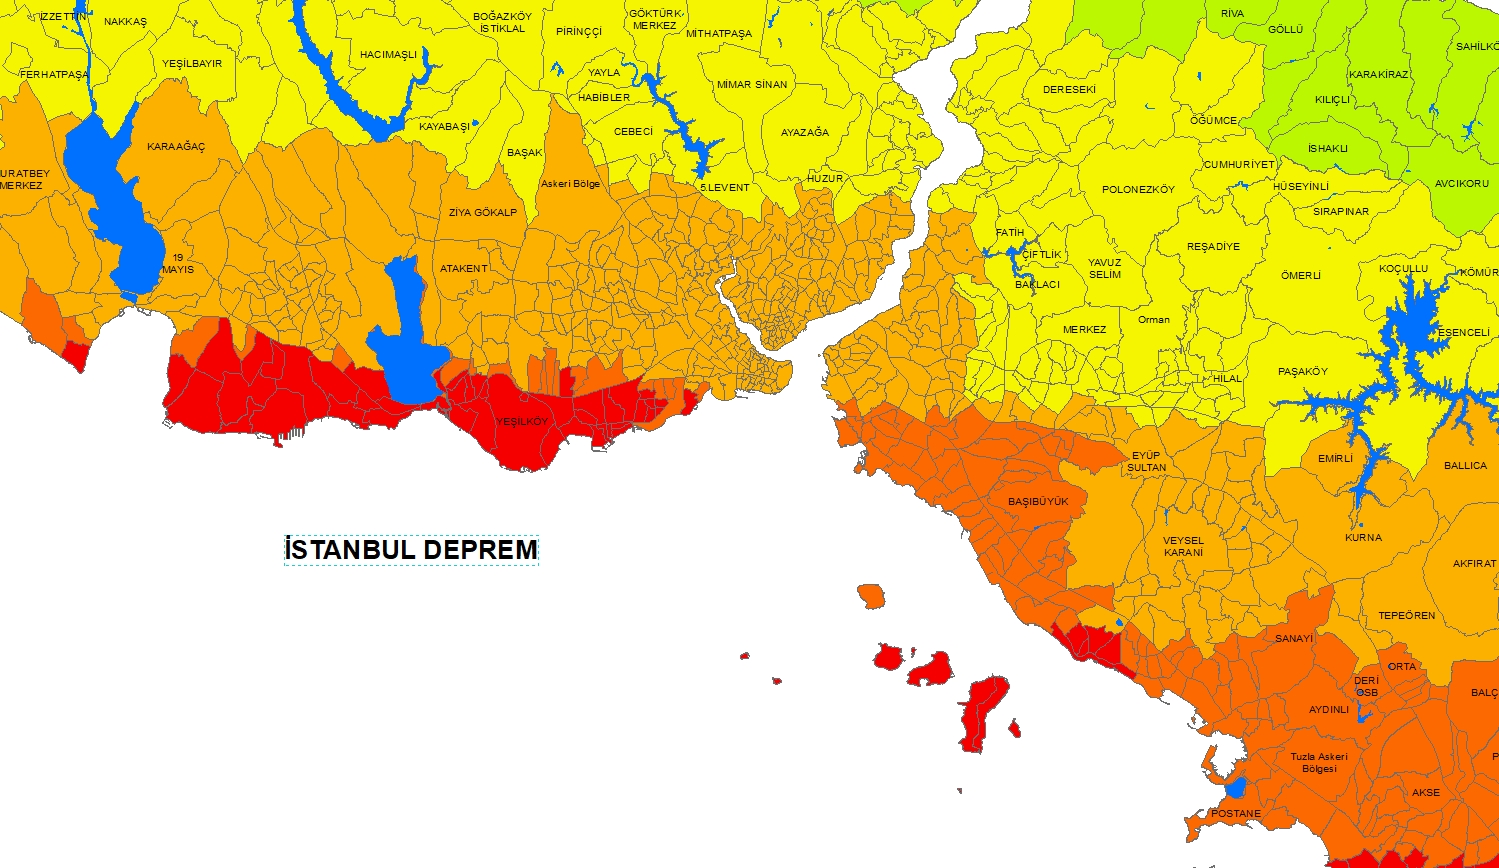
| EARTHQUAKE | Neighborhood Earthquake risk | |
| OSB | Is there an OSB in the region | |
| POI_DENSITY | Workplace density | |
| RISK_INDEX | Risk Index Calculated by Adres Harita LTD |
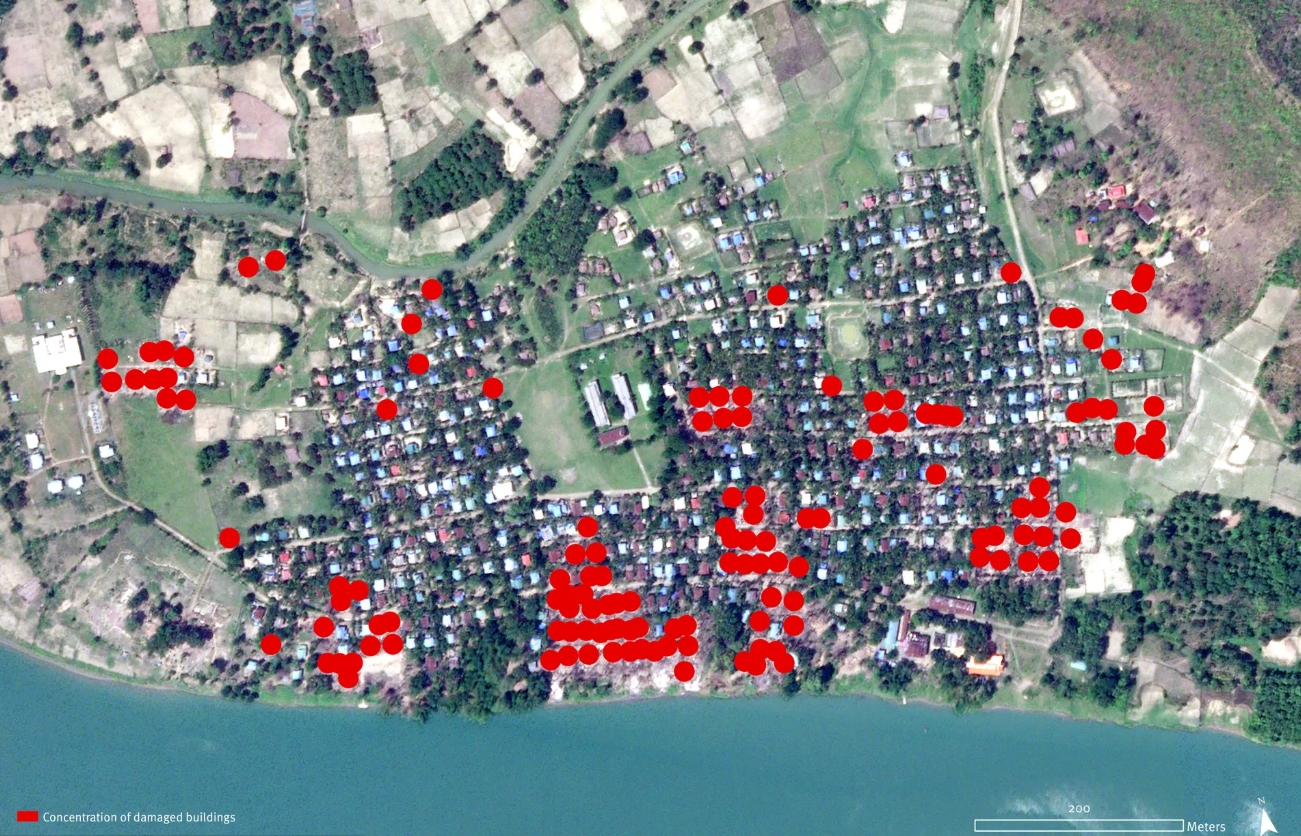
AFETLER
SCREENHUNTER 249
SCREENHUNTER 250
SCREENHUNTER 251
SCREENHUNTER 252
SCREENHUNTER 253
SCREENHUNTER 254